

November 1, 2025
Price Prediction System.
Backend · FrontendMy undergraduate thesis project: forecasting rice prices across East Java with Single and Double Exponential Smoothing, from an ETL pipeline on government price data to a Streamlit dashboard.
Description
Price Prediction System is the software behind my S1 (undergraduate) thesis at UDINUS: “Implementasi Metode Eksponensial Smoothing untuk Prediksi Harga Beras di Jawa Timur” — forecasting rice prices in East Java with exponential smoothing.
It collects daily rice prices from the East Java provincial government’s price-monitoring service, stores and aggregates them in MySQL, trains Single Exponential Smoothing (SES) and Double Exponential Smoothing (Holt / DES) models per city and rice grade, and presents the analysis and forecasts in a Streamlit dashboard. The method is explained in depth in Forecasting Harga dengan Exponential Smoothing (in Indonesian).
Background
Rice is Indonesia’s staple food, so its price matters to households, traders, and policymakers alike. East Java publishes daily commodity prices per regency/city through SISKAPERBAPO, but the raw data is scattered across dates and regions and is hard to read as a trend. The thesis asks a practical question: can a simple, explainable time-series method forecast rice prices accurately enough to be useful?
Goal
- Build a repeatable pipeline that collects and cleans rice price data for all regencies/cities in East Java.
- Compare SES and DES on the same data and pick the better model per series.
- Present daily analytics, monthly aggregates, forecasts, and city comparisons in an interactive dashboard.
Features
- ETL pipeline — fetches prices from the SISKAPERBAPO endpoint per date and commodity, transforms them, and loads them into MySQL. Commodities are keyed by ID, so it can be extended beyond rice.
- Coverage — medium and premium rice across 38 regencies/cities in East Java, January 2023 – June 2025 (100,000+ raw daily records).
- Monthly aggregation — daily prices are rolled up to roughly 30 monthly points per city × rice grade.
- Forecasting — SES and DES are fitted with statsmodels; the model with the lowest error on the test split (MAPE by default, or MAE/RMSE) is selected automatically. Forecasts and metrics are stored back in the database.
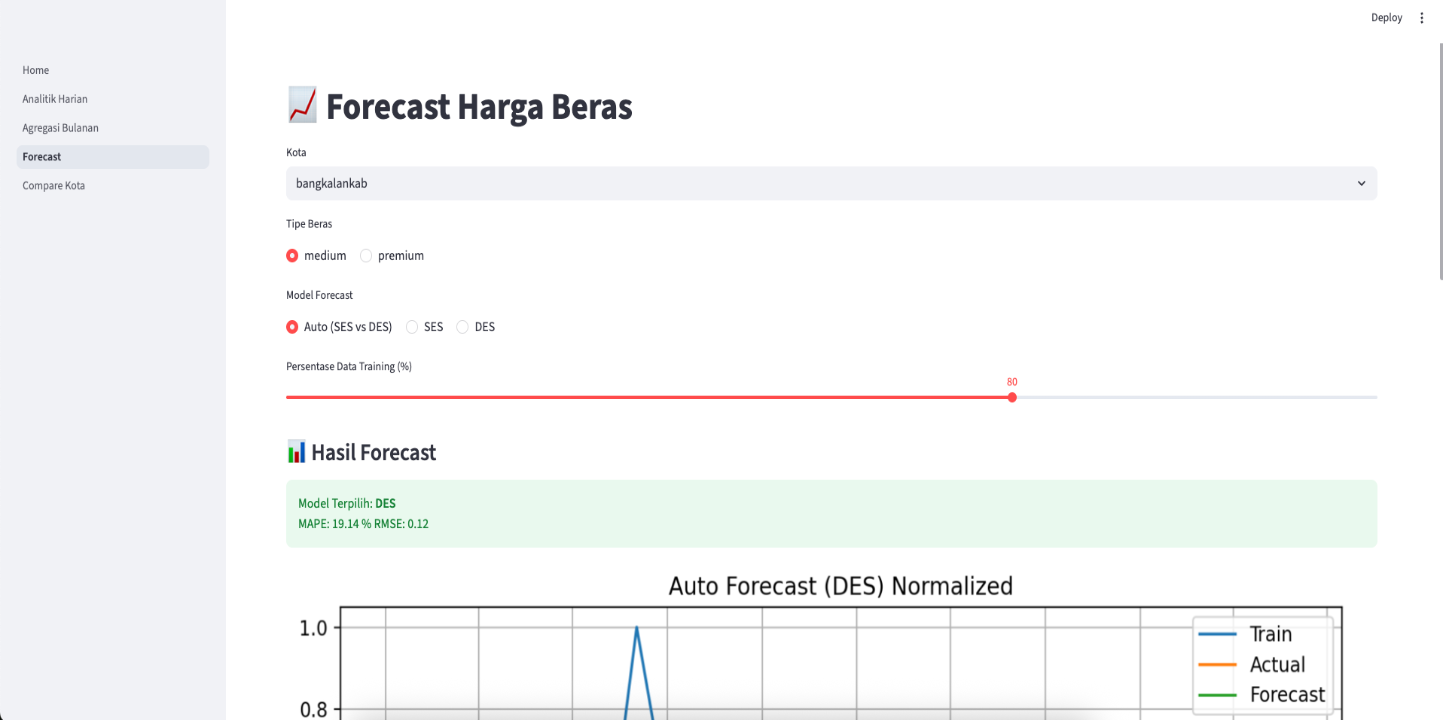
- Streamlit dashboard — pages for data fetching, daily analytics, monthly aggregation, forecasting (Auto/SES/DES with a 60–90% training-split slider, default 80%), and city-to-city comparison.
Technologies
- Python for the whole pipeline.
- Pandas and NumPy for cleaning, aggregation, and time-series handling.
- Statsmodels for SES and Holt’s linear trend (DES).
- MySQL with SQLAlchemy/PyMySQL for storage and migrations.
- Streamlit with Plotly and Matplotlib for the dashboard and charts.
How to Run
git clone https://github.com/FannyDevz/price-prediction
cd price-prediction

python -m venv .venv
source .venv/bin/activate   # Windows: .venv\Scripts\activate
pip install -r requirements.txt

# Create a .env with DB_HOST, DB_USER, DB_PASSWORD, DB_NAME, DB_PORT, then:
python -m database.migrations
python -m streamlit run app/Home.py
Technical Decisions
- Exponential smoothing over black-box models — SES and DES are simple, fast, and easy to explain, which suits a thesis and a dataset of about 30 monthly points per series, where heavier models would overfit.
- Automatic model selection — both models are evaluated on the same held-out data and the lower-error one is used, instead of assuming one method always wins.
- Database-backed pipeline — separating ETL, storage, and forecasting makes it possible to re-fetch data or re-run forecasts per city without redoing everything.
Results So Far
The thesis is still in progress. In the manual calculation for medium rice in Malang Regency (α = 0.5; α = β = 0.5 for DES), both methods fall in the “very good” range (MAPE below 10%): SES reached a MAPE of 1.97% (RMSE 288.71) and DES 1.86% (RMSE 277.69). DES edges ahead when the series has a trend, while SES stays competitive on stable prices.
What I Learned
- How exponential smoothing works under the hood — the role of α and β, and why DES handles trends better than SES.
- Building an end-to-end data pipeline, from an external API to a database to a dashboard.
- Evaluating forecasts carefully — for example, error metrics should be computed on prices in rupiah, not on normalized values, to be meaningful.
Notes
This is an academic project and a work in progress; the forecasts are for research, not for trading or policy decisions.
Read the story behind this project: Perjalanan Akademik (in Indonesian).

Hey! I’m Fanny, the software engineer tending to this digital garden. You can read more about me, or subscribe by email.